Back on January 6 of this year Kevin Butler posted a great article on converting Landsat 8 thermal bands to at-satellite brightness temperatures using the Raster Function Template Editor. The link to his article can be found here .
I will admit I have never used the raster function editor (ok, I didn’t even know it existed), so not being familiar with the raster editor, I had a hard time trying to follow Kevin’s instructions. I am familiar with ArcGIS’s Modelbuilder, though. Using the valuable information in Kevin’s article as a guide, I created a model that does the same thing. The result turned out pretty well and I have included it here as a toolbox that can be added to ArcGIS. You are free to use, modify, and/or change it all you want. All I ask is that if you find it useful or have any comments about it, let me know.
To use the tool, click on the link above and save the Landsat8.tbx file to your computer. Next, open ArcGIS and make sure the Toolbox side-panel is visible (The ESRI website has better instructions for adding toolboxes here . Right-click inside the panel and select “Add toolbox…” from the menu. Navigate to where you saved the Landsat8.tbx and select it (do not open it to show the model, just select the .tbx file). The Landsat8 toolbox is now added. Open it and inside there should be a model called LS8Therm.
Double click the LS8Therm model and enter the location of your Landsat 8 Band11 image, Band12 image, and where to save the output and what to call it (I used .tif files when I created the model).

Click ok and the tool should run;

I ran the tool using the LC80210322013121LGN01 dataset I downloaded from the USGS. Here is the result;

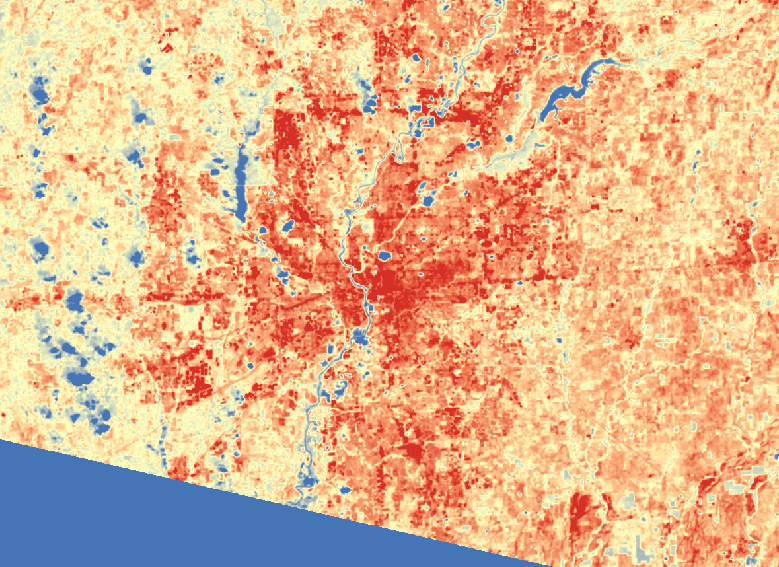
And zooming in for a closer look at Indianapolis, IN;

And then adding a quick symbology;
For anyone that wants to play around with the model, you can right click the model in the toolbox window and select edit. This will open the model in Modelbuilder.
One thing I did not do was preprocess the Landsat 8 data for cloud cover. On the left side of the above image you can see what looks like a series of lakes just to the west of the city. This is a line of clouds, so ideally you would preprocess to reduce cloud cover. The purpose of this was to show urban heat island effect, as can be seen by the darker red of the city compared to the outlying areas. If you were to add a shapefile of the administrative districts, they would follow the outlines of the high-heat areas very closely.
References:
Allen, D. (2011). Getting to know ArcGIS Modelbuilder. Redlands, CA: Esri Press.
Butler, K. (Jan. 6, 2014). Deriving temperature from Landsat 8 thermal bands (TIRS). Retrieved from http://blogs.esri.com/esri/arcgis/2014/01/06/deriving-temperature-from-landsat-8-thermal-bands-tirs/
