PURPOSE
To test the feasibility of a low cost, mobile environmental sensor system that could be used to sample air quality as needed and in areas where conventional sensor systems may not be available or cost effective.
METHODOLOGY
Based around the low-cost Arduino microcontroller, a GPS shield for capturing geographic location was paired with a relative humidity and temperature sensor to act as a mobile data logger. The relative humidity and temperature sensors were chosen for their cost and ease of implementation as an initial set of sensors. The sensors were mounted at the end of a five foot long section of one-inch PVC mast inside a one-inch to two inch tee fitting. The tee fitting was used to protect the sensors from direct sunlight and weather (Figure 1).
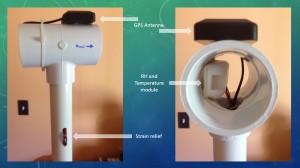
Figure 1
The entire unit is powered by a single 9-volt alkaline battery and housed inside a rigid plastic storage container to protect the equipment from handling and the elements. The 9-volt battery should power the unit for several hours and a 9-volt lithium may provide even more operating time (Figure 2).
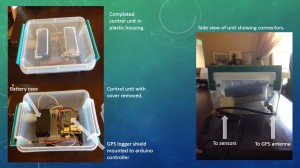
Figure 2
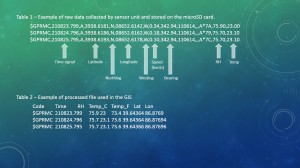
Software was modified based on that supplied by Adafruit industries, the makers and suppliers of the sensors and GPS unit. The software reads the raw GPS datastream and parses out the $GPRMC string, reads the relative humidity and temperature sensor, then writes these values as a line to a comma separated value text file on a microSD card on the GPS shield. Each additional reading from the time the unit is started is appended to this text file. If power is interrupted to the unit, when it restarts it will create a new file before appending data.
ANALYSIS
For the initial test of the unit, it was placed inside a backpack with the mast rising to approximately seven feet above the ground. The trip was made on a standard mountain bike and ridden at a nominal pace. The initial test site chosen was a road that runs from north to south from West Walnut Street in Greencastle, IN to the DePauw Nature Park parking lot. There is a change in elevation of roughly fifteen feet where the road enters the forest area at the north end. Otherwise the road is nearly level throughout. The distance covered was approximately 1.7 miles roundtrip and the sensor unit gathered 1059 data points during this trip. Riding was done by staying as close as comfortable to the outside edges of the road for not only safety reasons, but to also help determine the accuracy of the GPS unit.
The unit was turned on and allowed to get a fix on the satellite constellation, then an additional five minutes was allowed to elapse to allow the sensors to acclimate to ambient conditions. Upon return to starting position, the unit was turned off and the file from the microSD card removed and the file copied off.
The data file was opened in Microsoft Excel and the GPRMC latitude and longitude coordinates converted to decimal degrees for use in the GIS. This was done by extracting the degree portion of the latitude string, dividing the rest of the string by 60, then adding the two back together. The temperature was also converted from degrees Celsius to degrees Fahrenheit using the standard formula. Table 1 shows a sample of the raw data file collected and Table 2 shows a sample of the finished spreadsheet.
The resulting Microsoft Excel table was then opened in ArcGIS 10.1 and the XY data used to plot the points (Figure 3).

Figure 3
The projection used by the GPS constellation is WAS 1984 and that was what was used here. A basemap of aerial imagery was then added for reference. Finally, the point data was buffered to 25 meters, the points were kriged, and then the kriged raster was clipped using the buffer (Figure 4).

Figure 4
CONCLUSIONS
This project has shown the feasibility of using low cost, mobile arduino-based devices as environmental sensor systems that could be used to sample air quality as needed and in areas where conventional sensor systems may not be available or cost effective.
Several future considerations should be considered, including increasing the number and type of sensors such as adding benzene, NO2, or similar sensors. Additional or different sensors can be added or changed out with minimal effort in programming or hardware.
Another area of interest would be to outfit similar units with small solar panels and battery backup systems so that they could be placed in remote locations, thereby increasing the ability to monitor environmental pollution throughout a much wider area.
 Geospatial Health, Volume 8, Number 2, May 2014, Pages 429-435
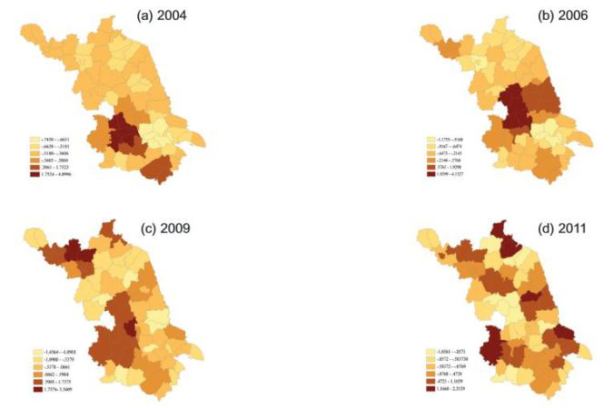 Spatial clusters of annual incidence of influenza (hotspots) in Jiangsu province, P.R. China, for the years 2004 (a), 2006 (b), 2009 (c) and 2011 (d).


